Dear all,
@Randy Holmes-Farley, as in related threads before: If this has too much of an advertisment character, feel free to delete this posting.
We try to regularly shed light onto the processes that happen within the Oceamo seawater laboratory.
Im having the feeling that this openness is very much appreciated within the community. For this reason I am happy to present some additional data (more will follow soon)
Previously we have shown how our ICP-MS measurements hold up against EU certified reference material, or have presented correctness and repeatability data.
A question that is often asked is the accuracy and precision of each individual value on the analysis report:
Below is my answer to Dan. A Quick summary:
The fact we are not presenting error ranges for each result on each report is not because we want to "hide" something from our customers - there is just no reasonable way to do so in a meaningful manner.
However, i do fully understand that customers would like to have knowledge of what typical accuracy and precision to expect from our results.
For this reason we have measured seawater control samples and CRMs of known composition.
Typically control samples with 3 different concentrations for each analyte were measured in triplicate on 3 individual measurement days. So the correctness, the measurement-to-measurement (same day) repeatability as well as the day-to-day repeatability can be evaluated and visually shown.
Since this dataset is very large, i have attached a PDF file, but would like to explain the data here on one example:
__________________________________________
This is data for Nickel, a known essential trace element.
Nickel
Method: ICP-MS (here we describe where this data is coming from - not all elements/ions can be measured with ICP-MS directly)
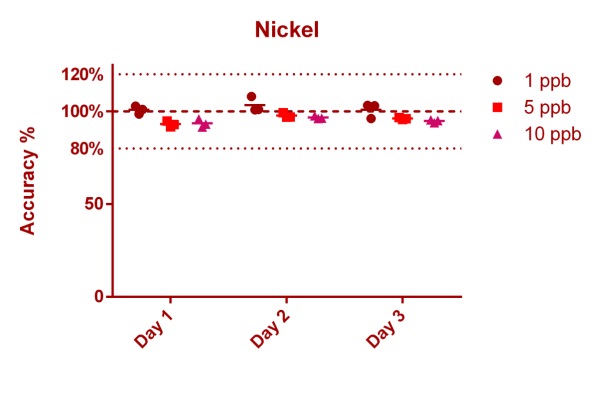
Mean accuracy @ 1 ppb: 101,70 (±3,32)% (9 Measurements split over 3 days)
Mean accuracy @ 5 ppb: 95,70 (±2,26)% (9 Measurements split over 3 days)
Mean accuracy @ 10 ppb: 95,05 (±1,85)% (9 Measurements split over 3 days)
Mean accuracy @ 1,04 ppb: 105,36 (±6,02)% (18 Measurements on 18 consecutive days, CRM data)
We measured 3 different control samples containing nickel at 1 ppb (µg/l), 5 ppb and 10 ppb concentration levels. Each point in the graph below represents a single measurement result. You can see that we measured all nickel control samples 3 times on 3 different days. 100% (on the Y axis) means, that the measurement result matched the known concentration of the control sample exactly (the best case scenario)
If for example the value is 90% at the 1 ppb level this would mean that the actual measurement result was 0.9 ppb (instead of the 1 ppb that the solution actually has).
The "Mean accuracy" values presented above for each concentration level are average % levels across all data points for the given concentration level, thus representing how well we do measure the correct concentration. The ± value represents the standard deviation of those % levels and indicates the spread of the results (the lower the better).
In addition in the second graph also the CRM data is shown (European certified reference material; not available for all analytes). Here we are showing one data point per measurement day (18 consecutive measurement days total, spread over several weeks). Again the mean accuracy and standard deviation were calculated as noted above.
![Nickel CRM [Ni 1,04 ppb CRM].png Nickel CRM [Ni 1,04 ppb CRM].png](https://test.reef2reef.com/data/attachments/3356/3356461-445dbf7e2c4971bc4b2546c92e21d4a9.jpg)
__________________________________________
I hope that this posting is useful to better judge results on our analysis reports.
If you are having any questions, i am happy to answer them!
Best regards, and have a nice weekend
Christoph
![Nickel CRM [Ni 1,04 ppb CRM].png Nickel CRM [Ni 1,04 ppb CRM].png](https://test.reef2reef.com/data/attachments/3356/3356461-445dbf7e2c4971bc4b2546c92e21d4a9.jpg)
@Randy Holmes-Farley, as in related threads before: If this has too much of an advertisment character, feel free to delete this posting.
We try to regularly shed light onto the processes that happen within the Oceamo seawater laboratory.
Im having the feeling that this openness is very much appreciated within the community. For this reason I am happy to present some additional data (more will follow soon)
Previously we have shown how our ICP-MS measurements hold up against EU certified reference material, or have presented correctness and repeatability data.
A question that is often asked is the accuracy and precision of each individual value on the analysis report:
Good post Christoph.
I have a quick question. What is preventing Oceamo from stating the accuracy and precision for each element in their ICP report?
Below is my answer to Dan. A Quick summary:
The fact we are not presenting error ranges for each result on each report is not because we want to "hide" something from our customers - there is just no reasonable way to do so in a meaningful manner.
Thank you Dan! Unfortunatel you will most likely not like my answer to your question:
Asking for accuracy and precision for every individual element in each individual run is very easy - but to deliver this data in a meaningful way is unfortunately almost impossible.
The CRM/QK data i provided in my first post give a good indication of accuracy and precision (accuracy: how close are we to the specified concentration, precision: how high is the variability between results).
I could now take this data and say (just as example) for arsenic we have a %RSD of 6,5% (calculated from the standard deveation and mean value of above 18 data points). This 6,5% RSD would however not be valid in general for arsenic. If the concentration of arsenic in the sample would be higher, the %RSD would be lower (better statistics) - if the arsenic concentration would be lower, it would be the other way round. Also factors such as salinity have an impact, if a sample would have very high salinity, %RSD would generally be higher.
To provide precision data for each individual analyses it would be rquired to run every sample several times to allow for statistics. This is however very time consuming, and would thus also increase cost very significantly. It is impossible to give data on accuracy for each individual result, because i do not know the actual ("true") concentration. - Accuracy can only be checked with CRMs or other control samples (data shown in my initial post).
However, i do fully understand that customers would like to have knowledge of what typical accuracy and precision to expect from our results.
For this reason we have measured seawater control samples and CRMs of known composition.
Typically control samples with 3 different concentrations for each analyte were measured in triplicate on 3 individual measurement days. So the correctness, the measurement-to-measurement (same day) repeatability as well as the day-to-day repeatability can be evaluated and visually shown.
Since this dataset is very large, i have attached a PDF file, but would like to explain the data here on one example:
__________________________________________
This is data for Nickel, a known essential trace element.
Nickel
Method: ICP-MS (here we describe where this data is coming from - not all elements/ions can be measured with ICP-MS directly)
Mean accuracy @ 1 ppb: 101,70 (±3,32)% (9 Measurements split over 3 days)
Mean accuracy @ 5 ppb: 95,70 (±2,26)% (9 Measurements split over 3 days)
Mean accuracy @ 10 ppb: 95,05 (±1,85)% (9 Measurements split over 3 days)
Mean accuracy @ 1,04 ppb: 105,36 (±6,02)% (18 Measurements on 18 consecutive days, CRM data)
We measured 3 different control samples containing nickel at 1 ppb (µg/l), 5 ppb and 10 ppb concentration levels. Each point in the graph below represents a single measurement result. You can see that we measured all nickel control samples 3 times on 3 different days. 100% (on the Y axis) means, that the measurement result matched the known concentration of the control sample exactly (the best case scenario)
If for example the value is 90% at the 1 ppb level this would mean that the actual measurement result was 0.9 ppb (instead of the 1 ppb that the solution actually has).
The "Mean accuracy" values presented above for each concentration level are average % levels across all data points for the given concentration level, thus representing how well we do measure the correct concentration. The ± value represents the standard deviation of those % levels and indicates the spread of the results (the lower the better).
In addition in the second graph also the CRM data is shown (European certified reference material; not available for all analytes). Here we are showing one data point per measurement day (18 consecutive measurement days total, spread over several weeks). Again the mean accuracy and standard deviation were calculated as noted above.

![Nickel CRM [Ni 1,04 ppb CRM].png Nickel CRM [Ni 1,04 ppb CRM].png](https://test.reef2reef.com/data/attachments/3356/3356461-445dbf7e2c4971bc4b2546c92e21d4a9.jpg)
__________________________________________
I hope that this posting is useful to better judge results on our analysis reports.
If you are having any questions, i am happy to answer them!
Best regards, and have a nice weekend
Christoph
![Nickel CRM [Ni 1,04 ppb CRM].png Nickel CRM [Ni 1,04 ppb CRM].png](https://test.reef2reef.com/data/attachments/3356/3356461-445dbf7e2c4971bc4b2546c92e21d4a9.jpg)


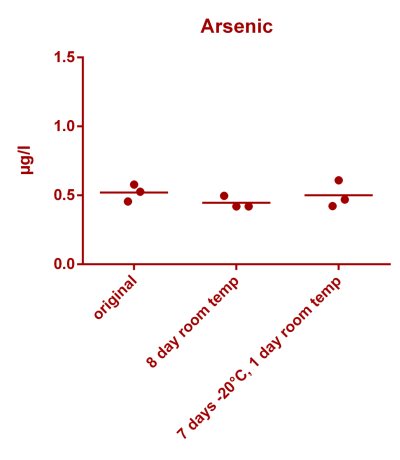
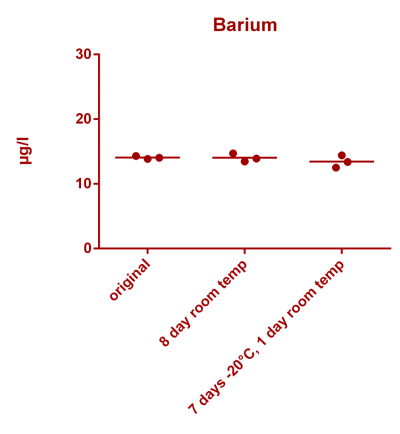
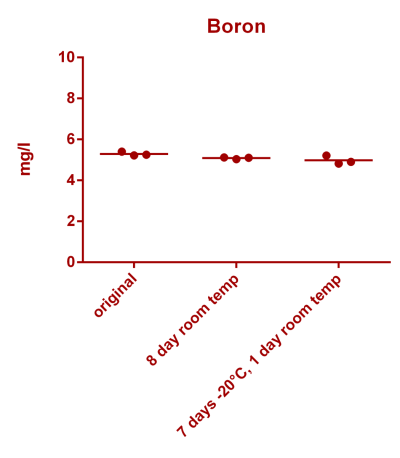
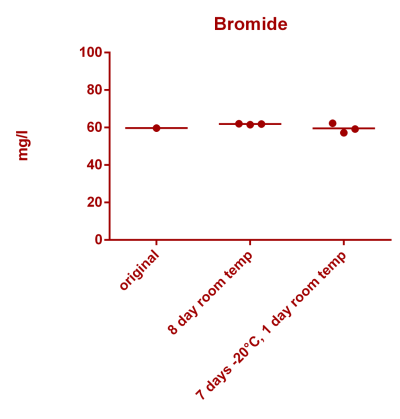
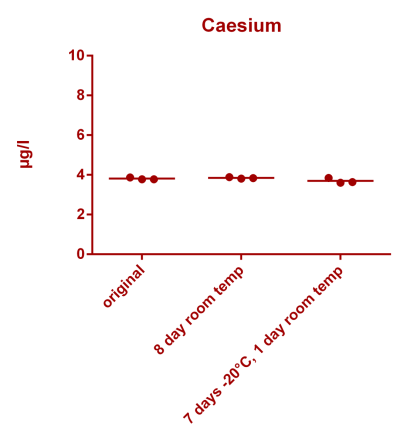
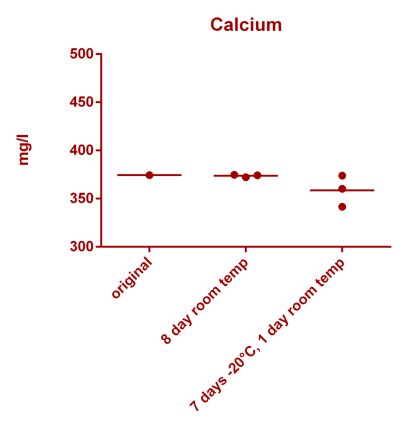
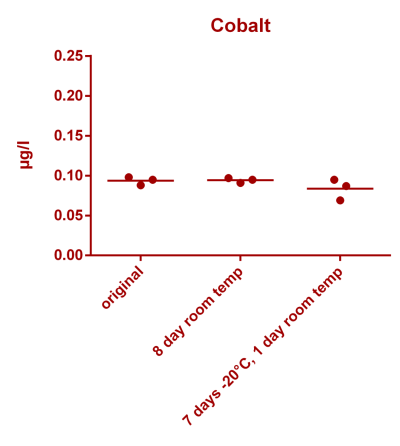
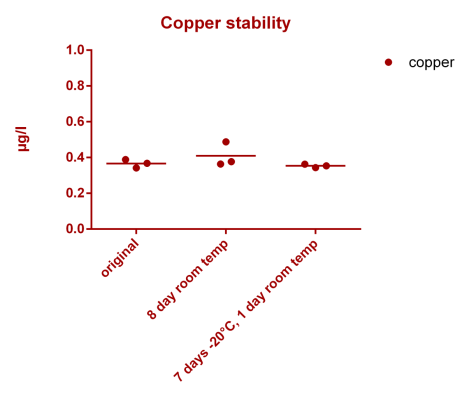
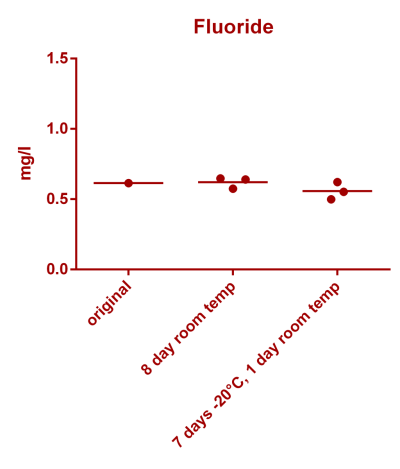
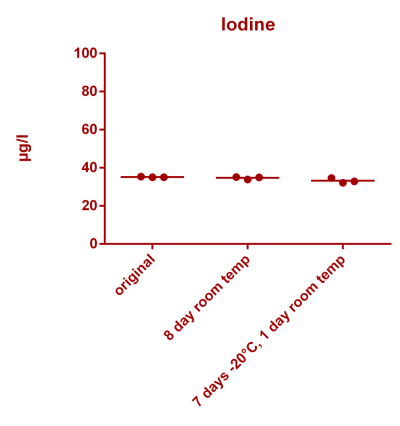
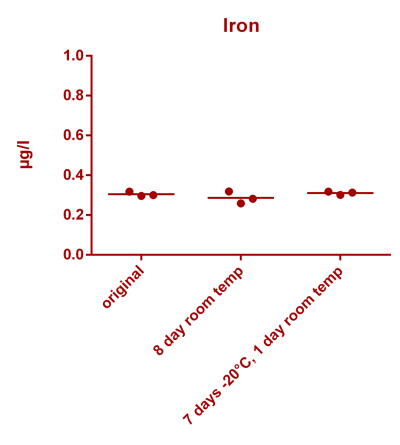
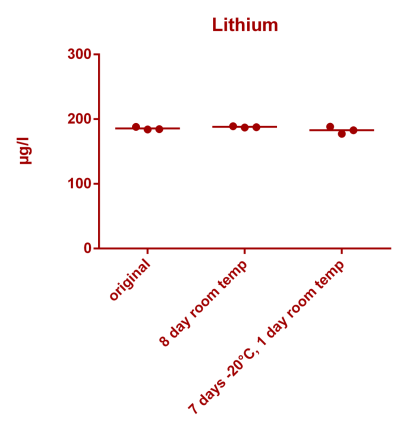
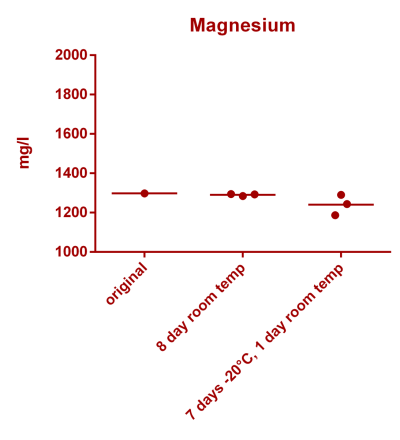
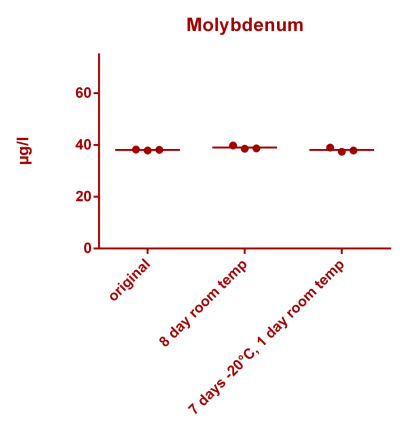
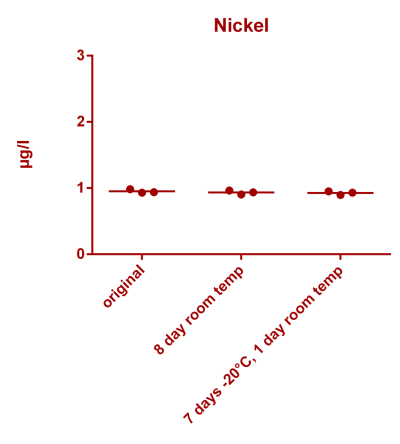
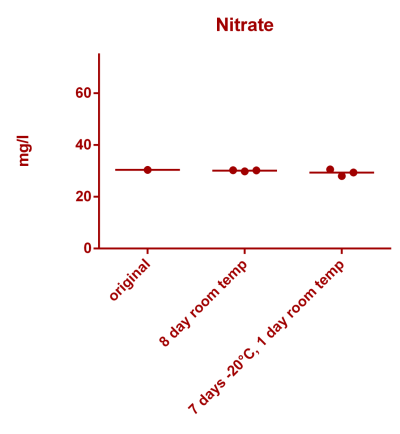
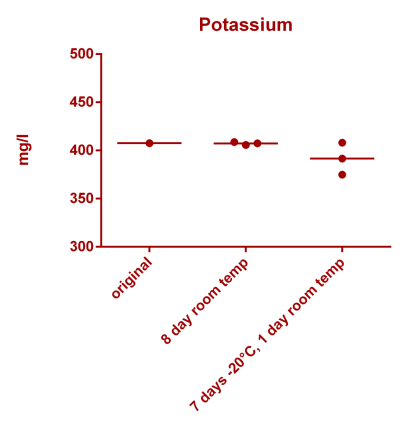
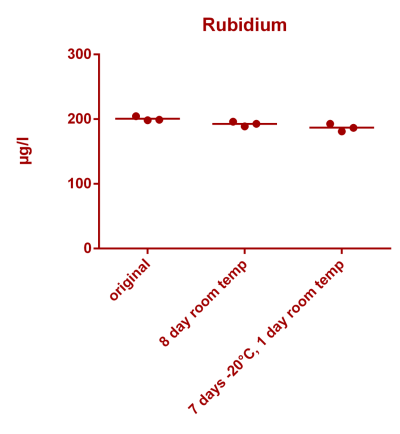
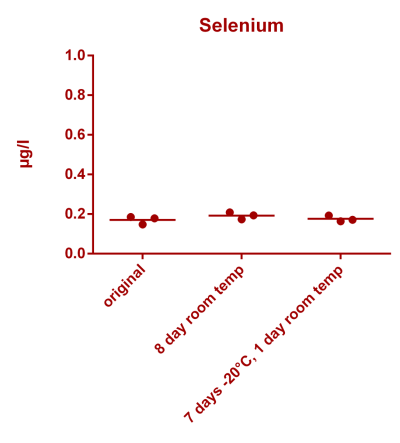
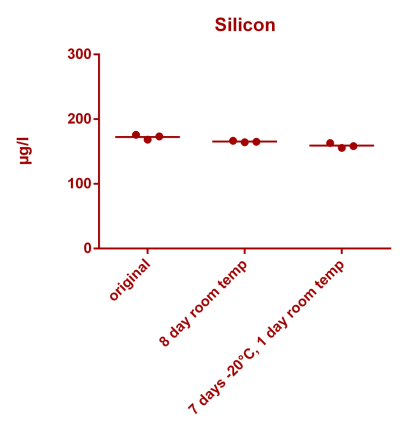
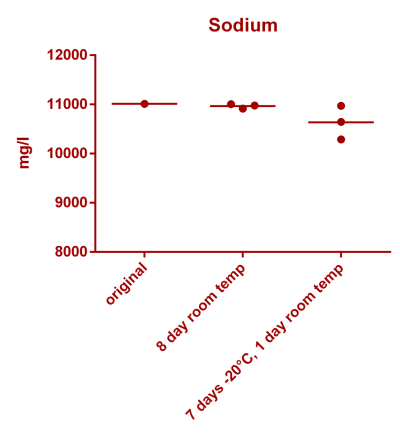
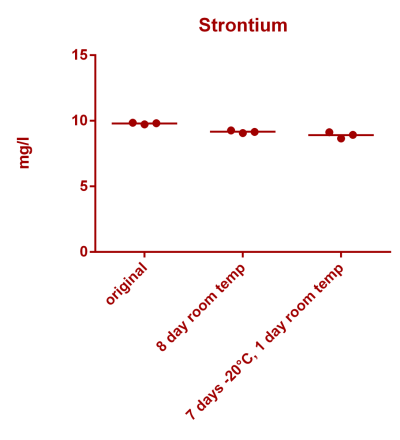
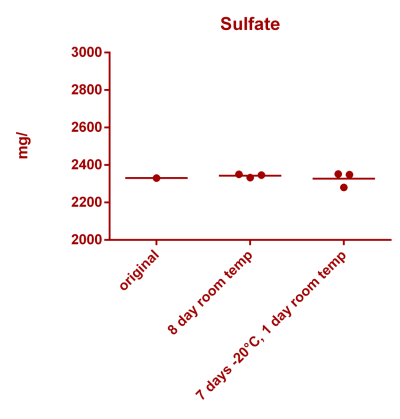
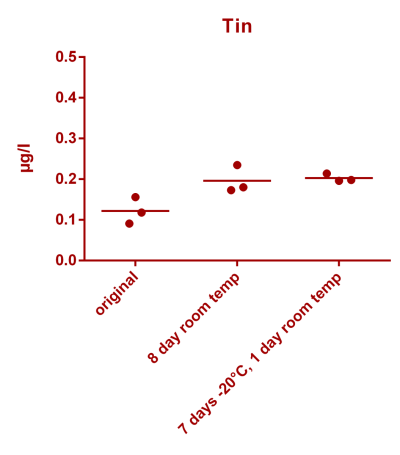
![Uranium stability [copper].png Uranium stability [copper].png](https://test.reef2reef.com/data/attachments/3359/3359844-34c0243a1d82a2327a39a856002104c9.jpg)
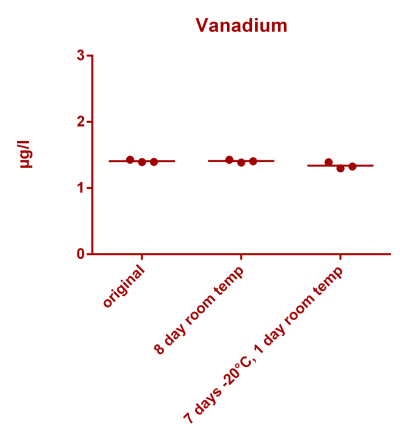
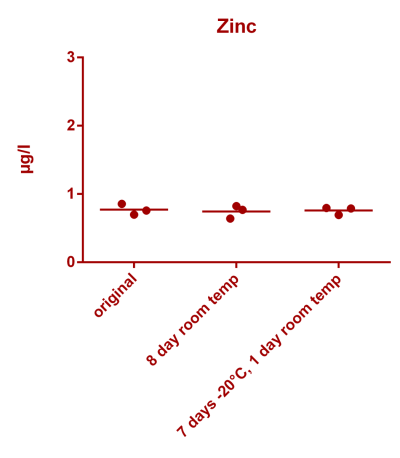


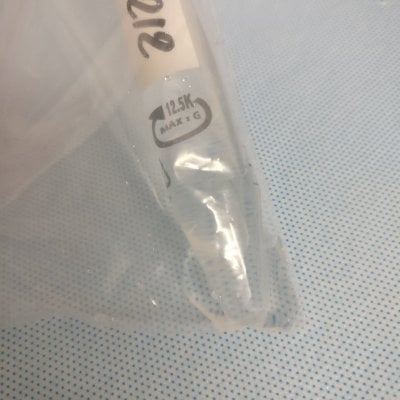
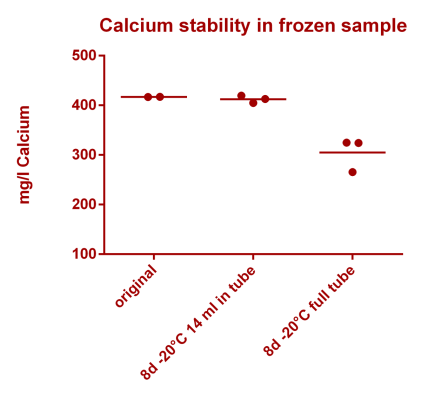
![Na stbility 2 [Na frozen sample stability].png Na stbility 2 [Na frozen sample stability].png](https://test.reef2reef.com/data/attachments/3414/3414495-c94d1335b1a7e07e77ea943457a581be.jpg)
![potassium stability 2 [Potassium frozen sample stabil]-1.png potassium stability 2 [Potassium frozen sample stabil]-1.png](https://test.reef2reef.com/data/attachments/3414/3414503-0b55d60d0553a48b540761fdfd31d76d.jpg)
![Levels in leaked liquid [Na frozen sample stability].png Levels in leaked liquid [Na frozen sample stability].png](https://test.reef2reef.com/data/attachments/3414/3414504-88fbad95ef8d02065694c24f04b0daf8.jpg)
