Nitrifying Bacteria. Where Are You?

J1a

Well-Known Member
View Badges
Joined
Nov 14, 2021
Messages
666
Reaction score
950
Location
Singapore
Rating - 0%
0   0   0
Low death rate I guess.
That's the tricky part, no? If the nitrospira does not die, but merely becomes dormant, I would expect the majority of them to become active at around the same time. If so, the graph should be rather linear after a initial lag time.

In this case, we see a growth pattern. So perhaps death did occur.

Or I could be completely worng.
 
OP
OP
Dan_P

Dan_P

7500 Club Member
View Badges
Joined
Sep 21, 2018
Messages
7,571
Reaction score
7,962
Rating - 0%
0   0   0
Interesting data, I would like to draw some ideas from it.

If we take the nitrite graph as a proxy measurement of nitrosipira population, the lag phase is curiously absent. This would suggest that the population of nitrifyer not only survived, but also hardly disrupted in the process of curing and transfer. The nitrifyers added to the test tank is immediately nitrifying and reproducing.

So the follow up question about the nitrifyer in the transferred sand is: does the nitrifyer population dies back during curing (less live bacteria, but whatever lives are active) or does the bacteria population merely becomes dormant.

Based on the exponential fit and the apparent lack of lag phase, I lean towards the former pathway.

A side note, maybe we can take the derivative of the nitrate graph to be a better proxy of the nitrifyer population.
I have seen a death rate estimate of 1% per day for AOB’s. That would leave 40% of the bacteria after 3 months. @taricha’s ammonia consumption at 48 hrs seems (0.4 ppm NH3-N) close to my 0.5 ppm NH3-N in 48 hrs for a recommended dose of BioSpira. Admittedly, this could just be a coincidence. So, I am still left wondering about the AOB’s ability to get into maintenance mode and hang around a long time, and then spring into action.
 
OP
OP
Dan_P

Dan_P

7500 Club Member
View Badges
Joined
Sep 21, 2018
Messages
7,571
Reaction score
7,962
Rating - 0%
0   0   0
That's the tricky part, no? If the nitrospira does not die, but merely becomes dormant, I would expect the majority of them to become active at around the same time. If so, the graph should be rather linear after a initial lag time.

In this case, we see a growth pattern. So perhaps death did occur.

Or I could be completely worng.
I think the assumption of linearity needs a relook. Might the start up time for bacteria follow some sort of statistical distribution? I‘ll bet on the statistical distribution but have no idea whether the ammonia consumption curve would resemble an exponential curve.
 

J1a

Well-Known Member
View Badges
Joined
Nov 14, 2021
Messages
666
Reaction score
950
Location
Singapore
Rating - 0%
0   0   0
I think the assumption of linearity needs a relook. Might the start up time for bacteria follow some sort of statistical distribution? I‘ll bet on the statistical distribution but have no idea whether the ammonia consumption curve would resemble an exponential curve.
If it's a normal distribution for start up, then I think i would expect something closer to a lag + linear graph. I did a simplified model to show the expected dynamic.

IMG_20220203_115442.jpg


I would say this mechanism is quite different from exponential growth.
 

Azedenkae

Valuable Member
View Badges
Joined
Feb 26, 2021
Messages
2,448
Reaction score
2,322
Location
Seattle
Rating - 0%
0   0   0
Nice demonstration of the staying power of AOB’s. Low death rate I guess.

There is one bit of information missing in my brain. What does the ammonia consumption look like for a resting population of AOB’s suddenly give ammonia? I read they can in some instances ramp up quickly (no pictures though) and in other instances they spend time turning on protein synthesis, sitting around not taking up ammonia. I am sorry now that I did not read more deeply.
The longer they have been starved of ammonia, the longer it takes to ramp up.
 

taricha

5000 Club Member
View Badges
Joined
May 22, 2016
Messages
6,970
Reaction score
10,747
Rating - 0%
0   0   0
So the follow up question about the nitrifyer in the transferred sand is: does the nitrifyer population dies back during curing (less live bacteria, but whatever lives are active) or does the bacteria population merely becomes dormant.
taricha’s ammonia consumption at 48 hrs seems (0.4 ppm NH3-N) close to my 0.5 ppm NH3-N in 48 hrs for a recommended dose of BioSpira
Yeah, in the data I posted it took ~4 days to clear ~1ppm ammonia-N, so 0.25ppm/day is a good estimate. But that same sand tested the same way immediately after 9 days of cycling (on ammonia drops) was processing 2+ppm/day. so this represents a ~90% decrease of Ammonia oxidation rate during the "curing" couple of months.

A side note, maybe we can take the derivative of the nitrate graph to be a better proxy of the nitrifyer population.
True, but since it's such a tight fit to an exponential, the derivative will just be a scaled exponential with the same rate constant.

What does the ammonia consumption look like for a resting population of AOB’s suddenly give ammonia? I read they can in some instances ramp up quickly (no pictures though) and in other instances they spend time turning on protein synthesis, sitting around not taking up ammonia.
Since this population had a high ammonia oxidizing capacity earlier, dormancy and regain of capability is plausible. Y'all are right to think about what the regain of function could look like. If it looks like this....
ammonia oxidizers.jpeg

...then there's a long tail of the fast responders waking up that could look like the exponential data I saw.
(but there's no good reason why the time dependence for that re-activation ought to look so much like a plausible doubling time for ammonia oxidizers. could be coincidence though.)

Might find this relevant to discussion at hand....
"Stationary-phase cells, washed and resuspended in ammonium free inorganic medium, were starved for periods of up to 42 days, after which the medium was supplemented with ammonium and subsequent growth was monitored by measuring nitrite concentration changes. Cultures exhibited a lag phase prior to exponential nitrite production, which increased from 8.72 h (no starvation) to 153 h after starvation for 42 days. Biofilm populations of N. europaea colonizing sand or soil particles in continuous-flow, fixed column reactors were starved by continuous supply of ammonium-free medium. Following resupply of ammonium, starved biofilms exhibited no lag phase prior to nitrite production, even after starvation for 43.2 days, although there was evidence of cell loss during starvation. Biofilm formation will therefore provide a significant ecological advantage for ammonia oxidizers in natural environments in which the substrate supply is intermittent."

That seems to be a plausible parallel for my months-long "curing" sandbed recirculating in the dark with no inputs.

(What were we talking about again? Sorry for the derail, Dan. :p )
 

Lasse

10K Club member
View Badges
Joined
Mar 20, 2016
Messages
11,262
Reaction score
30,666
Location
Källarliden 14 D Bohus, Sweden
Rating - 0%
0   0   0
Di
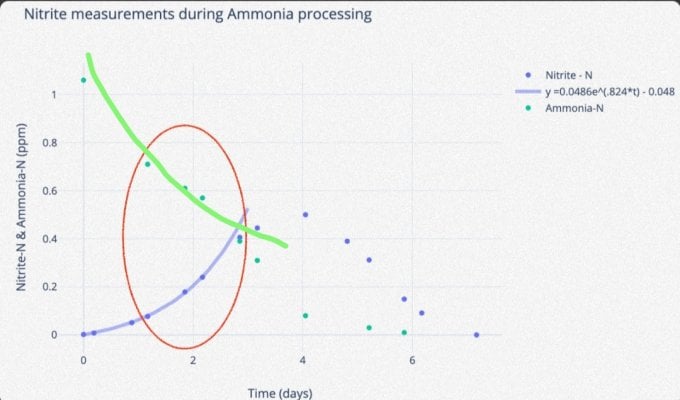
The green is the ammonia, but look at the blue - NO2-N. It's remarkable how cleanly you can fit it to an exponential for ~3 days.
Wait a second - if your exponential curve is similar to the rise of nitrite in your example it does not show the growth of only NOB - it shows the an combined exponential growth of both AOB and NOB instead - the nitrite that you measure is the waste product from the AOB and the resource for NOB, The waste production depends on the concentration (of NH3/NH4 their resource) and amount of AOB:s producing the waste (NO2). The use of the resource NO2 depends on the concentration of the resource and the amount of NOB:s consuming it. But your estimated growth rate is in line with other investigations I have seen. In pure media 13 hours - in combined longer

Or is my thinking wrong?

Sincerely Lasse
 

J1a

Well-Known Member
View Badges
Joined
Nov 14, 2021
Messages
666
Reaction score
950
Location
Singapore
Rating - 0%
0   0   0
Di

Wait a second - if your exponential curve is similar to the rise of nitrite in your example it does not show the growth of only NOB - it shows the an combined exponential growth of both AOB and NOB instead - the nitrite that you measure is the waste product from the AOB and the resource for NOB, The waste production depends on the concentration (of NH3/NH4 their resource) and amount of AOB:s producing the waste (NO2). The use of the resource NO2 depends on the concentration of the resource and the amount of NOB:s consuming it. But your estimated growth rate is in line with other investigations I have seen. In pure media 13 hours - in combined longer

Or is my thinking wrong?

Sincerely Lasse
Presumably the population of NOB has not become significant / or remain dormant during the first three days?

If there is the nitrate data for the same period then perhaps we will have a clearer picture.
 
OP
OP
Dan_P

Dan_P

7500 Club Member
View Badges
Joined
Sep 21, 2018
Messages
7,571
Reaction score
7,962
Rating - 0%
0   0   0
If it's a normal distribution for start up, then I think i would expect something closer to a lag + linear graph. I did a simplified model to show the expected dynamic.

IMG_20220203_115442.jpg


I would say this mechanism is quite different from exponential growth.
This makes things clear.
 
OP
OP
Dan_P

Dan_P

7500 Club Member
View Badges
Joined
Sep 21, 2018
Messages
7,571
Reaction score
7,962
Rating - 0%
0   0   0
Yeah, in the data I posted it took ~4 days to clear ~1ppm ammonia-N, so 0.25ppm/day is a good estimate. But that same sand tested the same way immediately after 9 days of cycling (on ammonia drops) was processing 2+ppm/day. so this represents a ~90% decrease of Ammonia oxidation rate during the "curing" couple of months.


True, but since it's such a tight fit to an exponential, the derivative will just be a scaled exponential with the same rate constant.


Since this population had a high ammonia oxidizing capacity earlier, dormancy and regain of capability is plausible. Y'all are right to think about what the regain of function could look like. If it looks like this....
ammonia oxidizers.jpeg

...then there's a long tail of the fast responders waking up that could look like the exponential data I saw.
(but there's no good reason why the time dependence for that re-activation ought to look so much like a plausible doubling time for ammonia oxidizers. could be coincidence though.)

Might find this relevant to discussion at hand....
"Stationary-phase cells, washed and resuspended in ammonium free inorganic medium, were starved for periods of up to 42 days, after which the medium was supplemented with ammonium and subsequent growth was monitored by measuring nitrite concentration changes. Cultures exhibited a lag phase prior to exponential nitrite production, which increased from 8.72 h (no starvation) to 153 h after starvation for 42 days. Biofilm populations of N. europaea colonizing sand or soil particles in continuous-flow, fixed column reactors were starved by continuous supply of ammonium-free medium. Following resupply of ammonium, starved biofilms exhibited no lag phase prior to nitrite production, even after starvation for 43.2 days, although there was evidence of cell loss during starvation. Biofilm formation will therefore provide a significant ecological advantage for ammonia oxidizers in natural environments in which the substrate supply is intermittent."

That seems to be a plausible parallel for my months-long "curing" sandbed recirculating in the dark with no inputs.

(What were we talking about again? Sorry for the derail, Dan. :p )
Brilliant and to the point.

I’ll just have to start a new post so that the experimental results coming out soon aren’t lost in the commentary on the introduction :)
 

taricha

5000 Club Member
View Badges
Joined
May 22, 2016
Messages
6,970
Reaction score
10,747
Rating - 0%
0   0   0
Wait a second - if your exponential curve is similar to the rise of nitrite in your example it does not show the growth of only NOB - it shows the an combined exponential growth of both AOB and NOB instead

Presumably the population of NOB has not become significant / or remain dormant during the first three days?

If there is the nitrate data for the same period then perhaps we will have a clearer picture.

Right. The exponential that fits the rise of NO2 tells something about the population of active Ammonia oxidizers. When it stops fitting the exponential 3+ days is when the NOB show up and become important.

if you look at the points in the Red oval, during this time frame - the ammonia decrease matches tightly to the NO2 increase - no "missing" N (yet). The blue and green data mirrors each other tightly.
Screen Shot 2022-02-02 at 3.14.06 PM.png

After that point, from 3+ days on, the NO2 level drops below what would be expected from the Ammonia decrease. That is, NO2 "goes missing" as it went to NO3.
I didn't try to test through NO2 to find NO3 during the time, but after clearing NO2, the final NO3-N was 1.5ppm (initial ~0.2ppm) and the input was 1.06 ppm Ammonia-N. So decent agreement with the classical ammonia->NO2->NO3 expectation.
 

J1a

Well-Known Member
View Badges
Joined
Nov 14, 2021
Messages
666
Reaction score
950
Location
Singapore
Rating - 0%
0   0   0
Right. The exponential that fits the rise of NO2 tells something about the population of active Ammonia oxidizers. When it stops fitting the exponential 3+ days is when the NOB show up and become important.

if you look at the points in the Red oval, during this time frame - the ammonia decrease matches tightly to the NO2 increase - no "missing" N (yet). The blue and green data mirrors each other tightly.
Screen Shot 2022-02-02 at 3.14.06 PM.png

After that point, from 3+ days on, the NO2 level drops below what would be expected from the Ammonia decrease. That is, NO2 "goes missing" as it went to NO3.
I didn't try to test through NO2 to find NO3 during the time, but after clearing NO2, the final NO3-N was 1.5ppm (initial ~0.2ppm) and the input was 1.06 ppm Ammonia-N. So decent agreement with the classical ammonia->NO2->NO3 expectation.
For the initial portion, barring any measurement accuracy issues, does not suggest a strong correlated NH4 and NO2.
If we look at the trend of the ammonium concentration, the change of gradient does not match up. IMG_20220203_210031.jpg

We should expect a increasing negative gradient for the green line, rather than what we are seeing now. Imo.
 

taricha

5000 Club Member
View Badges
Joined
May 22, 2016
Messages
6,970
Reaction score
10,747
Rating - 0%
0   0   0
For the initial portion, barring any measurement accuracy issues, does not suggest a strong correlated NH4 and NO2.
Right. The large initial drop in ammonia (day 0.0 to 1.0 data) clearly has nothing to do with the slowly ramping up ammonia->NO2->NO3 pathway.
It is either explained by measurement error as you mentioned (it's 1 ammonia data point) or by the fact that this was done with spiking my aquarium water that I later learned has more than enough DOC and DON to account for discrepancies in the data.
If some organic C is broken down in the first day, then that could explain an initial drop in ammonia without NO2/NO3 production, and a slow breakdown of organic N over the 7 days could explain more observed final NO3-N (1.5ppm) than initial Ammonia-N (1.06).
(or could just be measurement error.)

After getting to know my aquarium water better, I woulda done this with I.O. instead.
 

MnFish1

10K Club member
View Badges
Joined
Dec 28, 2016
Messages
24,326
Reaction score
23,111
Location
Midwest
Rating - 100%
1   0   0
Nice demonstration of the staying power of AOB’s. Low death rate I guess.

There is one bit of information missing in my brain. What does the ammonia consumption look like for a resting population of AOB’s suddenly give ammonia? I read they can in some instances ramp up quickly (no pictures though) and in other instances they spend time turning on protein synthesis, sitting around not taking up ammonia. I am sorry now that I did not read more deeply.
I am starting that experiment today. The rock in my 2 tanks have not been 'fed' for a month now (give or take). They were previously able to process 2ppm in approx 24 hours. Do you think a month is enough?
 
OP
OP
Dan_P

Dan_P

7500 Club Member
View Badges
Joined
Sep 21, 2018
Messages
7,571
Reaction score
7,962
Rating - 0%
0   0   0
I am starting that experiment today. The rock in my 2 tanks have not been 'fed' for a month now (give or take). They were previously able to process 2ppm in approx 24 hours. Do you think a month is enough?
If you wait another month, the days of starvation will resemble @taricha sand starvation duration and maybe we will be closer to direct comparison.
 

MnFish1

10K Club member
View Badges
Joined
Dec 28, 2016
Messages
24,326
Reaction score
23,111
Location
Midwest
Rating - 100%
1   0   0
If you wait another month, the days of starvation will resemble @taricha sand starvation duration and maybe we will be closer to direct comparison.
Darn - I added the ammonia today:) btw - between your experiments. - do you exchange all the water? I think I will do it - it gives a 1 month version at least. But at least I have the tanks to do the experiment 2 months from now:)
 
OP
OP
Dan_P

Dan_P

7500 Club Member
View Badges
Joined
Sep 21, 2018
Messages
7,571
Reaction score
7,962
Rating - 0%
0   0   0
Darn - I added the ammonia today:) btw - between your experiments. - do you exchange all the water? I think I will do it - it gives a 1 month version at least. But at least I have the tanks to do the experiment 2 months from now:)
Yes, 100% water changes between runs.
 

MnFish1

10K Club member
View Badges
Joined
Dec 28, 2016
Messages
24,326
Reaction score
23,111
Location
Midwest
Rating - 100%
1   0   0
If you wait another month, the days of starvation will resemble @taricha sand starvation duration and maybe we will be closer to direct comparison.
I just completed the study - in the 'experiment section' - within 24 hours - the free ammonia level was clearly back to safe - from 2ppm/alert. (after a month)
 

MnFish1

10K Club member
View Badges
Joined
Dec 28, 2016
Messages
24,326
Reaction score
23,111
Location
Midwest
Rating - 100%
1   0   0
And the problem with my study is the same as the problem with others - there is no 'proof' that there aren't heterotrophs contributing to the ammonia processing. it would be nice if there was an easy test to see which bacteria were where
 
OP
OP
Dan_P

Dan_P

7500 Club Member
View Badges
Joined
Sep 21, 2018
Messages
7,571
Reaction score
7,962
Rating - 0%
0   0   0
And the problem with my study is the same as the problem with others - there is no 'proof' that there aren't heterotrophs contributing to the ammonia processing. it would be nice if there was an easy test to see which bacteria were where
I take it that your system does not produce nitrite, just straight on to nitrate.
 
Back
Top