HOBBY GRADE TEST KITS CAN OUTPERFORM ICP MEASUREMENTS…REALLY??

rtparty

5000 Club Member
View Badges
Joined
Jan 19, 2010
Messages
5,388
Reaction score
9,137
Location
Utah
Rating - 100%
4   0   0
If we are showing photos that don't mean anything here, I have one...

This is a COLONY that I am watching for a local guy who is upgrading tanks. This COLONY was MOVED a few weeks ago. MOVED tanks. He cut it off the rock that it was on, so it lost all of it's base. Any of you worth your salt knows how VERY hard that it is to move a colony and not only have it survive, but thrive. The move broke off most of the tips, which happens. In the few weeks since, the tips have all healed an put on new growth to where you cannot even tell. This colony is in a fuge since I don't have room in a display for this large of piece, so not even the most ideal environment that I can have for it... but it is doing great, I think.

This is in my home. It is not some frag of easy-to-keep corals like montis or A. Austera. This is also not photos of somebody else's tank. However, this photo and my methods are as useless as the others on here, so I guess that I don't know why I even posted this? I guess that I have to wonder if an inch of new growth on a colony after a move could have been three inches if I only knew what my Cadmium or Selenium levels were.

This colony getting moved and thriving/growing in a few weeks is a big-boy-pants reefing event, I think. I guess that I am just lucky...

Screenshot 2023-10-10 at 3.30.07 PM.png

C’mon now. If you knew your Rubidium was 0.5ppb instead of 0.4ppb, this thing would have tripled in size already

:p
 

Lasse

10K Club member
View Badges
Joined
Mar 20, 2016
Messages
11,262
Reaction score
30,666
Location
Källarliden 14 D Bohus, Sweden
Rating - 0%
0   0   0
Is the coral animals that has synbiotic algae inside mostly a hunter or a farmer? The answer on that question will give a hint if trace elements in the water has any significant importance or not. If it is mostly a hunter - as corals without zooxanthella are - the prey will give the most of the necessary trace elements - if it is mostly a crop farmer - the crop must get its trace elements from the actual media - in the case of zooxanthella - it means the water. In the article I linked to in my first post - there is rather strong indications that the solution of Darwins paradox is the fact that corals with zooxanthella mostly are farmers that produce and eat its own food from the algae they host and produce. This i for me the most important indication that trace elements in the water can be critical and can be depleted.

I have still not get any answers why this levels of spikes was chosen? For copper - I have a slight idea that if the spike had been 10.24 µg/L (10 ppb instead - it has been impossible to measure with the hobby tests. This gives that even if a measurement with an ICP MS that is 50% off (or more) still is better than the hobby test.

And I can´t understand why the Ca spike was 153.6 mg/L (150 ppm) instead of 30.72 (30 ppm) to 51.2 mg/L (50 ppm) as an example. The iodine test was not a simple hobby test

IMO - if you are going to dose trace elements (or all elements with exceptions for calcium, magnesium, bicarbonate/carbonate) ICP-OES or ICP-MS tests are the best to manage the dosing - even if they are 100 % off (for the trace elements). Personally - I would never ever dose potassium without control with help of an ICP test of some type.

I do 3 - 4 ICP tests a year - have done it all these 7 years the aquarium has been up and run. I have around 24 Triton and around 10 Oceamo tests done. They are - for me - an important tool and a knowledge bas that I can compare with my visual observations of the aquarium.

I completely agree that pictures of healthy aquariums can´t be used as prove for that or that - its too complicated processes involved. But pictures before and after can be useful as a tool . Best should be a serie of pictures of aquariums as they develop with that or that method.

Sincerely Lasse
 

jda

10K Club member
View Badges
Joined
Jun 25, 2013
Messages
14,343
Reaction score
22,422
Location
Boulder, CO
Rating - 0%
0   0   0
I completely agree that pictures of healthy aquariums can´t be used as prove for that or that - its too complicated processes involved. But pictures before and after can be useful as a tool . Best should be a serie of pictures of aquariums as they develop with that or that method.

You really need to quit doing the method and see degradation to show that it was the method and not just the tank getting more mature or the hobbyist having more skill. ...so like before, during and after.
 

Lasse

10K Club member
View Badges
Joined
Mar 20, 2016
Messages
11,262
Reaction score
30,666
Location
Källarliden 14 D Bohus, Sweden
Rating - 0%
0   0   0
You really need to quit doing the method and see degradation to show that it was the method and not just the tank getting more mature or the hobbyist having more skill. ...so like before, during and after.
Maybe - but if my skills are based on gathering all the information a can get in order (inclusive ICP measurements) to manage the aquarium - it will degrade what ever. One example

I had a small catastrophe last fall - a lot of fishes die one night and during the rest of the year I lost some fish - one after another for a while. In januari - I did a ICP-MS analyse that show elevated potassium concentrations - above 500 mg/L. Eight years ago - I had similar situation with my old aquarium. ICP - OES analyse - that was rather new at that time shows values around 660 mg/L. I do not know if the high potassium concentrations are the cause in these events or not but IMO - knowings its nature - it is my prime suspect compound. But its also a difficult compound to get rid off. Most salts contain concentrations around 400 mg/L. However - I was able to get - at that time new - Oceamo corrector - a liquid salt with known similarity with natural saltwater. It is 4 parts - a base, a KH compound, a Ca compound and a potassium compound. The base is 0 in KH (or near), 0 in calcium and 0 in potassium. I did 10 WC - first a 40 L WC - after that during 9 days WC of 5 L/day. The aim was 390 mg/L of potassium. I did a normal ICP test 1 month later and it comes up with 390 mg/L of potassium - as wanted and calculated. The blue shadow shows the desired variations compensated for the measured salinity.

1697018020864.png

The result of this WC (total 85 L) shows also up in the analysis in February - most compounds is in the wanted range with exception of tin that I have had problem with for a while - not knowing why. Last 2 analyses show a concentration of around 16 µg/L . I send in a new yesterday.

It have been difficult to do this without my experiences of many ICP test and the posibillity to follow up.

Sincerely Lasse
 

ingchr1

Valuable Member
View Badges
Joined
Sep 9, 2018
Messages
1,597
Reaction score
1,205
Rating - 0%
0   0   0
Maybe - but if my skills are based on gathering all the information a can get in order (inclusive ICP measurements) to manage the aquarium - it will degrade what ever. One example

I had a small catastrophe last fall - a lot of fishes die one night and during the rest of the year I lost some fish - one after another for a while. In januari - I did a ICP-MS analyse that show elevated potassium concentrations - above 500 mg/L. Eight years ago - I had similar situation with my old aquarium. ICP - OES analyse - that was rather new at that time shows values around 660 mg/L. I do not know if the high potassium concentrations are the cause in these events or not but IMO - knowings its nature - it is my prime suspect compound. But its also a difficult compound to get rid off. Most salts contain concentrations around 400 mg/L. However - I was able to get - at that time new - Oceamo corrector - a liquid salt with known similarity with natural saltwater. It is 4 parts - a base, a KH compound, a Ca compound and a potassium compound. The base is 0 in KH (or near), 0 in calcium and 0 in potassium. I did 10 WC - first a 40 L WC - after that during 9 days WC of 5 L/day. The aim was 390 mg/L of potassium. I did a normal ICP test 1 month later and it comes up with 390 mg/L of potassium - as wanted and calculated. The blue shadow shows the desired variations compensated for the measured salinity.

1697018020864.png

The result of this WC (total 85 L) shows also up in the analysis in February - most compounds is in the wanted range with exception of tin that I have had problem with for a while - not knowing why. Last 2 analyses show a concentration of around 16 µg/L . I send in a new yesterday.

It have been difficult to do this without my experiences of many ICP test and the posibillity to follow up.

Sincerely Lasse
What do think caused the change in potassium from ~440 mg/l to ~515 mg/l in between those two samples? Seems like a significant change and does not follow the past trend.

Did you perform any confirmatory tests when you got that ~515 mg/l result?
 

jda

10K Club member
View Badges
Joined
Jun 25, 2013
Messages
14,343
Reaction score
22,422
Location
Boulder, CO
Rating - 0%
0   0   0
If this is the same Thomas that I know, he has had killer tanks long before ICP even existed.......just sayin.

Looks like tdb320 to me. Heck, he had nice tanks before r2r was a thing, IIRC.

It have been difficult to do this without my experiences of many ICP test and the posibillity to follow up.

When people were trying to kill bryopsis with elevated K, fish died - your suspicion is probably good. I imagine that you were dosing in some form and just over dosed in that year? You are incredibly talented and smart and you overdosed likely with all of the tools that you needed at your disposal and this should also be a lesson to those who want to control every element - it takes skill and even then there is some risk of misdose. I know that a kit like Salifert K only goes to like 500, or something, but that was enough to know that your trend was going high if you were looking.

Even though I have no real use for any ICP, I might think about getting one if I saw a value that was too high and I needed to create a formula to correct. I would still rather not dose anything and not get too high in the first place, but maybe the day will come when I see a need to dose other than my CaRx and iron.
 

Lasse

10K Club member
View Badges
Joined
Mar 20, 2016
Messages
11,262
Reaction score
30,666
Location
Källarliden 14 D Bohus, Sweden
Rating - 0%
0   0   0
@ingchr1 I have also triton tests and they are normally rather alike with expectation of the two last Triton test - that was lower than the responding Oceamo tests - but the situation was not total clear when I got the result - triton show also a tendency to higher values during the autumn of 2022 - not the same figures but rising. I did not include a Triton test in the run in January 2023.

Note - the time scale is not exact

1697040495948.png


In januari 2023 - I know five things.

1. I had problems with fish - not the corals - similar to the event back in 2015 that more or less wiped out my old aquarium from fish - but corals was more stunning than ever in that aquarium. Even if i it was not as problematic as in the beginning - I still lost fish now and then. ICP-OES figures from that aquarium shows potassium concentrations around 650 mg/L when I did my first ICP test (no background data)
2. Had information about rising concentrations of potassium from two different tests during the autumn of 2022
3. A singel test that show a high concentration - higher than wanted to be.
4. I did not know the source of this elevated concentrations - back in 2015 - I know it because I had (blindly - no ICP test available for me) dosed a mixed solution for better colours. However - I had done a change during the autumn - I had bought a KH director and it used around 0.6 L of aquarium water for tests (4 a day) I had to use an old bucket of salt in order to withhold salinity. It is also here my tin problems starts from not detectable to around 24 µg/L
5. I did not want to do a WC with the normal dry powder salts. - see § 4 why.

I contacted Christoph for advise and he mentioned this new product Oceamo Corrector there I could get a liquid and controlled salt solution without potassium. Its 10 time concentrated and does not content either Ca, alkalinity or K in the base solution - you add this when you prepare the normal salt solution.

Point 4 and 5 solved - I could do a WC and because the salt do not have any potassium in it - it was easy to calculate a plan for WC. First a 40 L WC (310 L in the aquarium) bringing down the K concentrations to around 450 mg/L (theoretical) and after that 5 L WC for 9 days - bringing it down to 390 mg/L.

I send in a new ICP-OES a month after the first test and could notice that the theoretical decrease from 513 to 390 mg/L was real. The new analyse show a concentration of 390 mg/L - as wanted. It was a 24 % decrease. The decrease of tin was in the same country - around 30%

With this said - I think that my high reading was true but as you indicate - I could not know for sure at the moment I took the decision to do WC in order to bring the concentration down. If I only have had § 3 - a single high reading and not the other paragraphs - I would probably have sat still in the boat and wait for the next ICP test.

I imagine that you were dosing in some form and just over dosed in that year?
No I did not dose - however as I said above - I did add saltwater that I had blend from a normal dry powder form. Brand is not important - I misstrust most of them.:)
In my chemical cabinet - there is potassium solutions - I may have mixed it up when I prepare other solutions from the same cabinet.

Nowadays - I add in average around 600 ml new saltwater a day (Oceamo corrector mixed as a salt) as a substitute for the 600 ml my KH director produce as waste

I send in a new ICP-MS test yesterday - probalbly I will have the result to the weekend

Sincerely Lasse
 
Last edited:

pixelhustler

Active Member
View Badges
Joined
Jul 20, 2020
Messages
210
Reaction score
175
Location
Los Angeles
Rating - 0%
0   0   0
So let’s say that Hobby Grade test kits are 2% more accurate than some ICP labs. So what. It’s not going to crash your reef.

2%? Did you read the findings of the experiment or are we just making up numbers here?

And yes, based on the findings of the experiment, relying solely on ICP can indeed crash your reef. Oceamo, who you say is the gold standard, was off by 19% from the real copper values, while the hobby grade kits were off by an avg of 3%.

Honestly, pushing so hard in defense of ICP tests, when all the data we have available thus far points in the exact opposite direction, is just diminishing your credibility. No one said testing 40+ elements it’s not useful, but these findings imply they just might not be very accurate. These aren’t “margins” of error we’re talking about but outright errors.

Your tank is very nice, indeed, and I’m happy moonshiners is working for you but I can show you nice tanks with great growth by people who haven’t done a water test in months. The reality is this hobby presents us with many challenges to master before a focus on trace elements can even make a noticeable impact.

Let’s not forget investors flushed $700M down the toilet on Theranos because they relied on feelings more than they relied on hard data.
 

Lasse

10K Club member
View Badges
Joined
Mar 20, 2016
Messages
11,262
Reaction score
30,666
Location
Källarliden 14 D Bohus, Sweden
Rating - 0%
0   0   0
Oceamo, who you say is the gold standard, was off by 19% from the real copper values, while the hobby grade kits were off by an avg of 3%
The spike used was 0.25 ppm (256 µg/L). In that case the findings may be right. But does it say what you think - that its better to use Hanna checkers 702 and 747 for manage copper dosing's in real reef? I will say instead that this can be the best evidence ever for the claim that ICP tests is very helpful when you dose trace elements - why - read below

When you analyse Cu in a reef - the amount of wanted Cu is around 0.001-0.0019 ppm (1-2 µg/L). The Hi 702 (specified 0-5 ppm = 0 - 512 µg/L) was used by tester 1 and lowest detection it has is 0.01 ppm (10.24 µg/L) with the accuracy of ± 50 ppm (± 51.2 µg/L) - it means that it is pointless to use for measurements below 51.2 µg/L and the resolution is 5 times higher than the 2 µg/L that´s acceptable in a reef. The HI-747 was used by tester 2 and it is specified from 0 - 999 ppb (0-1022 µg/L) Resolution 1 ppb (1.024 µg/L) and accuracy of ± 10 ppb (±10.24 µg/L) This means that 747 is also pointless to use below 10.24 µg/L as tool for dosing.

Look at these two result of margin of error for the three test runs in each sample and tester
Tester 1
1697114382442.png


Tester 2

1697114442655.png


Tester 1 has margin of error ± 0.036/± 0.028 ppm (± 37/27 µg/L) and tester 2 have ± 0.021/± 0.013 ppm (± 21.5/±13.3 µg/L) How in the whole word can anyone think that these instruments can be useful in order to manage copper in a living reef aquarium?

On the other way - i do not say it is that way - the findings that Oceamo catch 81% of the spike in this test can be translated to their measurements in the low µg/L range - it means that my last 3 copper analyses from them 2.85 µg/L (ICP-MS) . 1.8 µg/L (ICP) and 2.2 µg/L (ICP) in reality was 3.5 µg/L (ICP-MS) . 2.2 µg/L (ICP) and 2.7 µg/L (ICP) - Do you know - I can live with that and gladly use their results in order to manage my reef.

This according to copper but Iron may be another question. The spike is around 12 to 4 times higher than the wanted span (1-3 µg/L). I do not know the calibration procedure of the ICP machine and its accuracy to concentrations around 12 µg/L. The only thing I know is that the accuracy for the used Hanna is ±20 ppb (±20.48 µg/L) The testers reported error of margin is ± 1/2 ppb, ±2.85/2.61 ppb and ±8.98/1.13 ppb. This means that the supposed reading of 1-3µg/L can´t be trusted with this meter either.

Sincerely Lasse
 
Last edited:
OP
OP
Rick Mathew

Rick Mathew

Valuable Member
View Badges
Joined
Mar 21, 2016
Messages
1,481
Reaction score
4,748
Location
North Central Florida
Rating - 0%
0   0   0
Here is my first serous objection. This is not average testers - these is the royalty of home testers with many testing hours in their backbones. What you are comparing here is how proffesional/semiproffesional testers succeed to get good readings from hobby tests and compare them with commercial labs - pro against pro with other words
First of all thank you for your thoughtful response….Very refreshing!

With regard to your first serious objection of the facilities and skill levels of the 3 testers:

The tests that we performed were done with the same test kits and Hanna Checkers that anyone can purchase….As a matter of fact from the pictures of your home lab we use some of the same kits. We followed the instructions for each of the tests as the manufacture instructed, paying close attention to the sections that gave hints on how to make the results more accurate…Which most test kits provide (like below)


Nothing was done out of the ordinary with the test protocol. The use of a single channel pipettes for measuring the required amounts of water and reagent may have been used. They have been shown to enhance the accuracy and precision somewhat if calibrated and used correctly, but it is not by a large margin (from a relative STDEV 3.6% to 1.35%)…. they are also easier and quicker to use than a standard test kit syringe…

That’s it!... each test run 3 time and recorded the results….What a lab looks like IMO has little to do with the outcome…Our hypothecs was not that anyone could do this, just that it could be done….That being said, I believe any person with a bit of practice and willing to follow the instructions an good laboratory practices could do the same if they chose to IMO.

The home lab picture (Rick’s) is mostly things that are needed for method development, making high purity standards, evaluating tests vs known concentrations. Very little of it has anything to do with pouring a Hanna PO4 packet in a vial or doing a Calcium titration. Most people reading this thread aren't going to do those things any different than us.

@taricha-----The analogy

"Early in the thread sisterlimonpot mentioned the idea of changing your own oil vs taking it to the oil change place around the corner. I really like that analogy for explaining how I think about our results. If you are a car guy/gal and you have the tools, you can probably do a good job on routine maintenance like oil changes, and there's no reason to say the shop around the corner has to be better than what you can do in your garage.

The same holds here with what we are trying to say about tank testing. If you have the right tools, your kit gives you sensible results, and you are comfortable using them for routine measurements, then for those things - it's not the case that ICP will likely give you a better or truer value. In my perspective, we're not trying to say anything about the "average" hobbyist or what their results will be. Maybe the average Reef Chem forum user, or the average reader who is interested enough to digest our article - the Reef equivalent of car guys/gals who have the right tools in their garage and like to tinker and do it themselves. We're certainly not trying to say the average american car owner would be better off grabbing a wrench and trying to change their own oil. Nor does our article have any relevant info for the hobbyist that tests a new bag of salt and gets Calcium of 200, or some other such nonsense.

I think the analogy works at a number of levels, so keep that in mind for what our expectations are for others and their testing experience. Even the car people won't have every tool in their garage for every problem - some problems will require outside tools and expertise.

We also know there are bad test kits out there - we intentionally chose kits that have a good reputation in the hobby, and it's not crazy to suggest that the good reputation is at least weak evidence that people other than us can use them to get sensible consistent results.

It needs to be said again because we think it's underappreciated: if hobbyists understood the enormous amounts of technical corrections that have to be done at the machine, statistical, and human expert operator levels to get an ICP service to give consistent results from one day to the next vs your titration that need only have consistency in the sample volume, titrant volume and titrant concentration to behave consistently, people would approach their results with a much more balanced perspective."

Second objection: Why use PPM and not mg/L

"ppm" and "ppb" are the most common units discussed on the forums, the most rigorously scientific would be to use micro- and nano- moles etc. but nobody does that and we made choices for clarity.

Question about Spiking Levels:

Many people target higher than 400ppm levels of Ca, and a number of them can have salinity errors as well, so it's not uncommon to see ICP reports for users with Ca over 500. that's well within their calibration range.

The copper spike is far higher than would be expected in "normal" water so fine if some readers want to disregard it as uninformative, but if you want to look for the relevance of that level, it would be relevant if hunting for metal contamination/corrosion leading to toxicity. Interestingly, one of the vendors did not flag that level as clearly toxic. Undesirable, but not obviously toxic. (it is right at ATI's posted upper limit of quantification, BTW)

Why test iodine with a not standard hobby method?

Iodine is a standard test, the innovation in Rick's method is to control time, and temperature, and use colorimetry to get a precise number. The test itself is probably the most commonly used one (Red Sea)

Fe - 12ppb is indeed far higher than natural seawater, but there are dosing regimes (Red Sea and others) where users add far higher levels than that. Some of those do send this water to be tested by ICP.

Salifert Potassium test is a titration that is quite easy, but now is discontinued :-( work is ongoing. ICP results were very good on potassium.

Phosphorus is simple in this case. We dosed PO4, so everyone - chemical and ICP can measure the dosed analyte. Conversions are just choices in presentation of units as P or PO4.

Silica as SiO2 is not terribly high. Many report values at those levels, and some dose Si aiming for similar levels - Sanjay's water tested at comparable levels in his reefbuilders article.

For the titration tests - did all the testers known the right spike?
The samples were sent to them without the actual spiked amounts, but they were provided to them later in order to do their analysis.

P is too complicated for me to understand what´s really are tested

We measured phosphorous using the Hanna Checker, which actually measures PO4 and the converts to P…All of the ICP vendors measure straight up “P” with the exception of Oceamo who used a chemical test to arrive at their results.


@Rick Mathew - some of the links in the appendix does not work for me

I do not know why some of the reference links work and others do not….If you copy the URL and paste it into the address bar they appear to work.


To finish this up, we would like to be clear we are not against ICP testing and we are not trying to encourage people to not use ICP testing. We are asking a simple question “How accurate and precise are the ICP results we receive as compared to our test results?”...I personally have used ICP test results to help me calibrate my test results and support my methods development….Potassium/Calcium and Iodine good examples. If something strange started happening to my tank I would most likely get an ICP analysis done….

From the results of this experiment one can see that ICP testing does well in some things but not so well and others. The issue is what about the other 40 or 50 elements for which we have no hobby grade chemical tests available to us to compare results….What is their accuracy and precision??...Are we just to accept that the values we get are correct…and from which vender? ...Then the really big question “Does it matter and if so which elements”…which seems to be a part of this discussion and is actually a Fitness for Use question

Once again Lasse thanks for responding to our efforts…much appreciated
 

Dan_P

7500 Club Member
View Badges
Joined
Sep 21, 2018
Messages
7,571
Reaction score
7,962
Rating - 0%
0   0   0
On the other way - i do not say it is that way - the findings that Oceamo catch 81% of the spike in this test can be translated to their measurements in the low µg/L range - it means that my last 3 copper analyses from them 2.85 µg/L (ICP-MS) . 1.8 µg/L (ICP) and 2.2 µg/L (ICP) in reality was 3.5 µg/L (ICP-MS) . 2.2 µg/L (ICP) and 2.7 µg/L (ICP) - Do you know - I can live with that and gladly use their results in order to manage my reef.
Hi Lasse,

I think that I follow the arguement. I wanted to add a footnote.

When we say

findings that Oceamo catch 81% of the spike in this test

we should keep in mind this was for one test only. Maybe next time they catch 100% of the spike, or maybe 120% or even. 40%. All ICP vendors have the same shortcoming: they provide the user with no indication of how much variation there is in their results. The test results below 10 ppb are likely to have even larger variation. But this might not be a problem.

As I said above, we really don’t know the required range of trace element concentrations for coral to grow well. If the range is actually large relative to the precision of the ICP results, the current situation of unknown precision in hobby ICP results could be OK because close is good enough.
 

Christoph

Active Member
View Badges
Joined
May 23, 2017
Messages
273
Reaction score
592
Location
Vienna, Austria
Rating - 0%
0   0   0
Hello everyone,

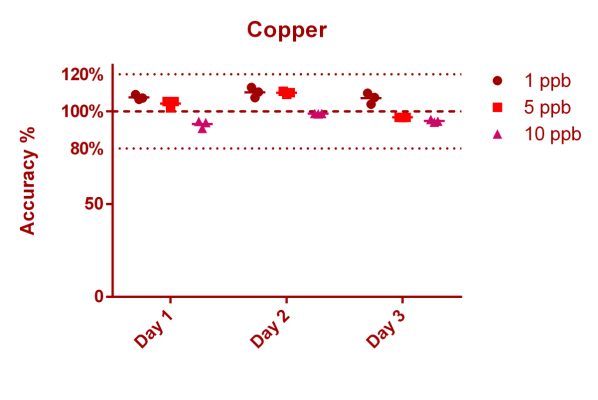
maybe this is a good point to add some precision/accuracy data for the analyte copper (Oceamo ICP-MS seawater analysis) here. Data is based on triplicate measurement of three different concentration levels in seawater matrix based standard on 3 different measurement days. In addition data from a CRM that was measured on on 18 consecutive days (but not in triplicate, only one datapoint per day).

This is "typical" data and not automatically valid for all samples. As i have outlined before many aspects influence signal, so for example in very high salinity samples lower accuracy/precision is to be expected.

Copper
Method:
ICP-MS

Mean accuracy @ 1 ppb: 108,33 (±2,62)% (9 Measurements split over 3 days)

Mean accuracy @ 5 ppb: 103,70 (±5,87)% (9 Measurements split over 3 days)

Mean accuracy @ 10 ppb: 95,62 (±2,72)% (9 Measurements split over 3 days)

Mean accuracy @ 0,87 ppb: 109,28 (±13,3)% (18 Measurements on 18 consecutive days, CRM data)


Copper.png
Copper CRM [Cu 0,87 ppb CRM].png

I hope this is helpful!
best regards,
Christoph

Copper CRM [Cu 0,87 ppb CRM].png
 
Last edited:
OP
OP
Rick Mathew

Rick Mathew

Valuable Member
View Badges
Joined
Mar 21, 2016
Messages
1,481
Reaction score
4,748
Location
North Central Florida
Rating - 0%
0   0   0
Hello everyone,

maybe this is a good point to add some precision/accuracy data for the analyte copper (Oceamo ICP-MS seawater analysis) here. Data is based on triplicate measurement of three different concentration levels in seawater matrix based standard on 3 different measurement days. In addition data from a CRM that was measured on on 18 consecutive days (but not in triplicate, only one datapoint per day).

This is "typical" data and not automatically valid for all samples. As i have outlined before many aspects influence signal, so for example in very high salinity samples lower accuracy/precision is to be expected.

Copper
Method:
ICP-MS

Mean accuracy @ 1 ppb: 108,33 (±2,62)% (9 Measurements split over 3 days)

Mean accuracy @ 5 ppb: 103,70 (±5,87)% (9 Measurements split over 3 days)

Mean accuracy @ 10 ppb: 95,62 (±2,72)% (9 Measurements split over 3 days)

Mean accuracy @ 0,87 ppb: 109,28 (±13,3)% (18 Measurements on 18 consecutive days, CRM data)


Copper.png
Copper CRM [Cu 0,87 ppb CRM].png

I hope this is helpful!
best regards,
Christoph

Copper CRM [Cu 0,87 ppb CRM].png
Very nice Christoph! ...Having a "Typical confidence interval" is very helpful...It is also a good tool over time to see if there is "drift" in the equipment and or test protocol. For us that was part of our standard quality system practice for really critical tests. Were these done by the same operator? Thanks for sharing this...very encouraging!
 
OP
OP
Rick Mathew

Rick Mathew

Valuable Member
View Badges
Joined
Mar 21, 2016
Messages
1,481
Reaction score
4,748
Location
North Central Florida
Rating - 0%
0   0   0
Hello everyone,

maybe this is a good point to add some precision/accuracy data for the analyte copper (Oceamo ICP-MS seawater analysis) here. Data is based on triplicate measurement of three different concentration levels in seawater matrix based standard on 3 different measurement days. In addition data from a CRM that was measured on on 18 consecutive days (but not in triplicate, only one datapoint per day).

This is "typical" data and not automatically valid for all samples. As i have outlined before many aspects influence signal, so for example in very high salinity samples lower accuracy/precision is to be expected.

Copper
Method:
ICP-MS

Mean accuracy @ 1 ppb: 108,33 (±2,62)% (9 Measurements split over 3 days)

Mean accuracy @ 5 ppb: 103,70 (±5,87)% (9 Measurements split over 3 days)

Mean accuracy @ 10 ppb: 95,62 (±2,72)% (9 Measurements split over 3 days)

Mean accuracy @ 0,87 ppb: 109,28 (±13,3)% (18 Measurements on 18 consecutive days, CRM data)


Copper.png
Copper CRM [Cu 0,87 ppb CRM].png

I hope this is helpful!
best regards,
Christoph

Copper CRM [Cu 0,87 ppb CRM].png
Would you be so kind as to tell me how you calculate Mean Accuracy ...Is this the same as Margin of Error/ Confidence Interval or relative Accuracy?
 
OP
OP
Rick Mathew

Rick Mathew

Valuable Member
View Badges
Joined
Mar 21, 2016
Messages
1,481
Reaction score
4,748
Location
North Central Florida
Rating - 0%
0   0   0
Tester 1 has margin of error ± 0.036/± 0.028 ppm (± 37/27 µg/L) and tester 2 have ± 0.021/± 0.013 ppm (± 21.5/±13.3 µg/L) How in the whole word can anyone think that these instruments can be useful in order to manage copper in a living reef aquarium
Those values ± .036/ ±.028 for tester #1 and ± .021/± .013 for tester # 2 are the measurement error for the level of copper tested which was a total .25 ppm so they are relative to this level of copper, they are not absolute values….So the reported value would be….

.277 ppm ± 0.036 ppm .27 ppm ± 0.028 ppm for tester # 1

.24 ppm ± 0.021ppm .25 ppm ± 0.013 ppm for tester #2

The two values that I focus on are the Margin of Error % and the Relative Accuracy %. (see below) These are not absolute values, although they can and do change as the measurement value goes up or down….Generally they get larger as the measurement gets smaller and smaller. That being said a good robust test protocol will do a fairly good job of compensating for these different levels.
1697143376816.png

These two values are a good “yardstick” for comparing two test methods…so all we need is the data from the ICP venders to be filled in and we can get a much better comparison of any individual test’s performance. It is really limiting to have a discussion on accuracy without knowing the margin of error.
1697143416200.png

In our previous article we address the question of precision but did not have the standards to get a look at accuracy and with a limited budget we had to choose one so we chose precision….

NOTE: The post that @Christoph just posted (https://www.reef2reef.com/threads/h...urements…really.1007101/page-42#post-11833357 ) is filling in this above chart.
 

Christoph

Active Member
View Badges
Joined
May 23, 2017
Messages
273
Reaction score
592
Location
Vienna, Austria
Rating - 0%
0   0   0
Sure, i have for all datapoints calculated the percentage of the measured value of the "true/expected" value (so for example if we measured 0,90 ppb while the expected value is 1 ppb that results in 90% accuracy). Those are also the datapoints plotted in the diagrams posted above.

What i am stating as "mean accuracy" is the average (and standard deviation) of those percentage values. If you are having suggestions how to present this data in another (maybe better) way, just le me know!

best regards,
Christoph
 
OP
OP
Rick Mathew

Rick Mathew

Valuable Member
View Badges
Joined
Mar 21, 2016
Messages
1,481
Reaction score
4,748
Location
North Central Florida
Rating - 0%
0   0   0
Sure, i have for all datapoints calculated the percentage of the measured value of the "true/expected" value (so for example if we measured 0,90 ppb while the expected value is 1 ppb that results in 90% accuracy)

What i am stating as "mean accuracy" is the average (and standard deviation) of those percentage values. If you are having suggestions how to present this data in another (maybe better) way, just le me know!

best regards,
Christoph
Thanks, that is helpful in understanding what those values are...When dealing with statistics it is always best to have a clear understanding of where the values come from...if you know the calculation the "name" is not as important...Thanks again
 

Lasse

10K Club member
View Badges
Joined
Mar 20, 2016
Messages
11,262
Reaction score
30,666
Location
Källarliden 14 D Bohus, Sweden
Rating - 0%
0   0   0
Many people target higher than 400ppm levels of Ca, and a number of them can have salinity errors as well, so it's not uncommon to see ICP reports for users with Ca over 500. that's well within their calibration range.
Red Sea say its Ca in the blue bucker target 430 mg/L ( 420 ppm) and with your spike - it should be around 550 ppm (564 mg/L) - but I know of experiences that I often have measured around 400 mg/L (391 ppm) - with 150 ppm spike - it gives 541 ppm (554 mg/L)

Oceamos and Tritons reported Ca concentrations is compensated for the measured salinity, The blue shadow shows the desired value range att each measure point - calculated from salinity at that moment

1697139673135.png


The pike here was 2022-08-07 and I did a Triton test the same day - Oceamo 606 mg/L and Triton 609 mg/L It was a result of overdosing Triton Core7:2

The tests that we performed were done with the same test kits and Hanna Checkers that anyone can purchase….As a matter of fact from the pictures of your home lab we use some of the same kits. We followed the instructions for each of the tests as the manufacture instructed, paying close attention to the sections that gave hints on how to make the results more accurate…Which most test kits provide (like below)

Nothing was done out of the ordinary with the test protocol. The use of a single channel pipettes for measuring the required amounts of water and reagent may have been used. They have been shown to enhance the accuracy and precision somewhat if calibrated and used correctly, but it is not by a large margin (from a relative STDEV 3.6% to 1.35%)…. they are also easier and quicker to use than a standard test kit syringe…

IMO - seriously - every one that have participate in a lab course knows that experience is the main factor in order to get a good accuracy in your analyses. I use to say that at least the first 25 analyses I do with a unknown method is like I using a shotgun - after that I normale become a 3:rdh grade sniper

The samples were sent to them without the actual spiked amounts, but they were provided to them later in order to do their analysis.
This means that the know the spike value in the moment they tested it?

According to copper - please see Christoph´s data

With this - do you mean a purchased Certified Reference Material? Not done in your Lab?

but there are dosing regimes (Red Sea and others) where users add far higher levels than that
You mean that some vendors products add more than 12.3 µg/L Fe to the aquarium? I have dosed Fe for a long time and my rule have been (before ICP-MS) that if I see any Fe in the analyse - go down in dose or stop. My Triton have always shown 0 but I have done 11 analyses at Oceamo. 7 normal ICP and 3 MS. See below

1697143675388.png


.277 ppm ± 0.036 ppm .27 ppm ± 0.028 ppm for tester # 1

.24 ppm ± 0.021ppm .25 ppm ± 0.013 ppm for tester #2
And first tester use an instrument there the instrument´s lowest reading is 0.01 ppm and the accuracy is ±0.05 ppm - It is not even possible to read concentrations below 0.01 ppm (10.23 µg/L) with this instrument

Tester 2 instrument have the range of 0- 0.999 ppm and resolution 0.001 ppm (1.024 µg/L) It looks like this can be used but - the accuracy is ±0.01 ppm (10.24 µg/L) This means that if you read 0.001 ppm - the real value is between 0 and 0.011 ppm. All this is after the manufactures specification. You can´t transfer your percentage into a measure range that´s the instrument can´t handle. The accuracy for tester 1 in a range the instrument can handle is better than the accuracy the manufacture specify ±0.036/0.027 ppm compared with ±0.05 ppm specified of the manufacturer. The accuracy for tester 2 is worse compared with the specification by Hanna ±0.021/0.011 ppm compared with ±0.01

Sincerely Lasse
 
Last edited:

HAVE YOU EVER KEPT A RARE/UNCOMMON FISH, CORAL, OR INVERT? SHOW IT OFF IN THE THREAD!

  • Yes!

    Votes: 32 45.7%
  • Not yet, but I have one that I want to buy in mind!

    Votes: 9 12.9%
  • No.

    Votes: 26 37.1%
  • Other (please explain).

    Votes: 3 4.3%
Back
Top