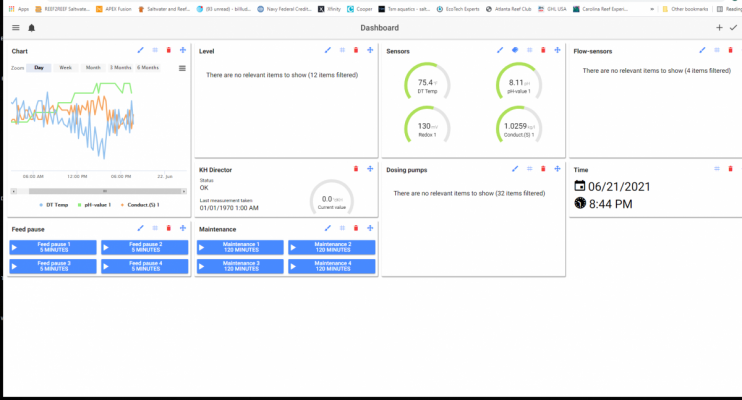
So what would I see if I had a profilux and opened the app to see what was going on with my tank or wanted to see what my ph did for the day?
You could see the graph one of two ways:
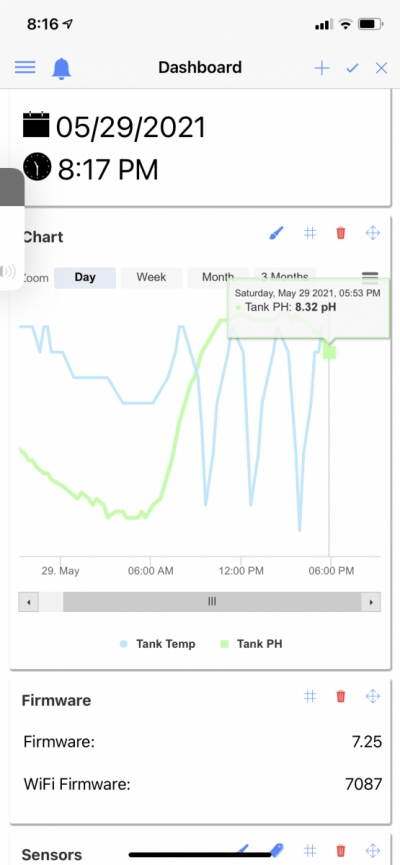
You could add a tile to your dashboard and add the sensors you want to appear in that tile like below when you open up your dashboard:

or
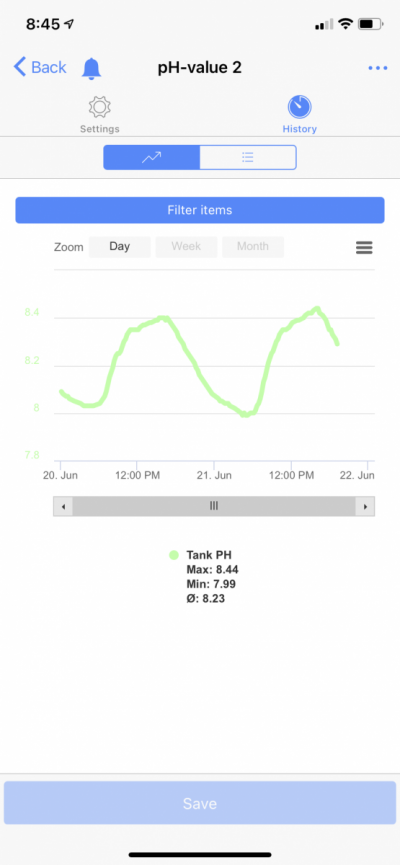
You can click on the a sensor on the dashboard For example PH and then choose history.


