Navigation
Install the app
How to install the app on iOS
Follow along with the video below to see how to install our site as a web app on your home screen.
Note: This feature may not be available in some browsers.
More options
You are using an out of date browser. It may not display this or other websites correctly.
You should upgrade or use an alternative browser.
You should upgrade or use an alternative browser.
What does this mean?
- Thread starter scotty333
- Start date
- Tagged users None
- Joined
- Jul 16, 2009
- Messages
- 5,071
- Reaction score
- 8,108
- Joined
- Jul 16, 2009
- Messages
- 5,071
- Reaction score
- 8,108
I will let Randy or somebody else better equipped answer if the ICP results should be trusted to convey that information and how relevant it is.
I think he’s fell out with me *sobs*
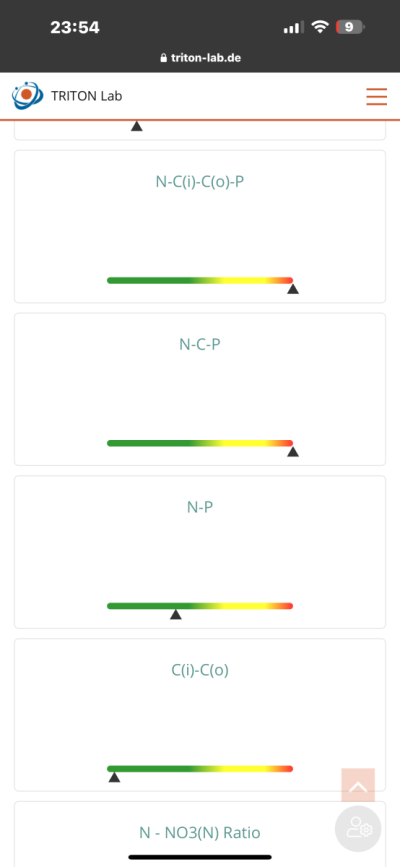
Looking again my inorganic carbon is spot on it’s just the ratio that’s out but there’s no values , since this was done I’ve changed out 50% water but haven’t changed any methods of it not going out of balance again
Will do another next week to check
Looking again my inorganic carbon is spot on it’s just the ratio that’s out but there’s no values , since this was done I’ve changed out 50% water but haven’t changed any methods of it not going out of balance again
Will do another next week to check
Randy Holmes-Farley
Reef Chemist
View Badges
Staff member
Super Moderator
Excellence Award
Expert Contributor
Article Contributor
R2R Research
My Tank Thread
Can you post the whole analysis?
Sure bossCan you post the whole analysis?
Cheers for stepping in

Triton Lab Showroom - Explore this water test results and click on the image above.
Someone wants to show you the water test results and shared this link to the evaluation. Click on the image above to explore the water test results.
Randy Holmes-Farley
Reef Chemist
View Badges
Staff member
Super Moderator
Excellence Award
Expert Contributor
Article Contributor
R2R Research
My Tank Thread
In general I’m not a fan of all that ratio talk.
35 euro savedIn general I’m not a fan of all that ratio talk.
God I owe you a couple of millers
Randy Holmes-Farley
Reef Chemist
View Badges
Staff member
Super Moderator
Excellence Award
Expert Contributor
Article Contributor
R2R Research
My Tank Thread
I have a real problem seeing the rationale here. All the measurements are in the green. Some ratios are fine and some Triton doesn’t like. I’m not even sure how three or four things can be a single ratio.
Personally I’d accept all the numbers seem ok and be done with it.
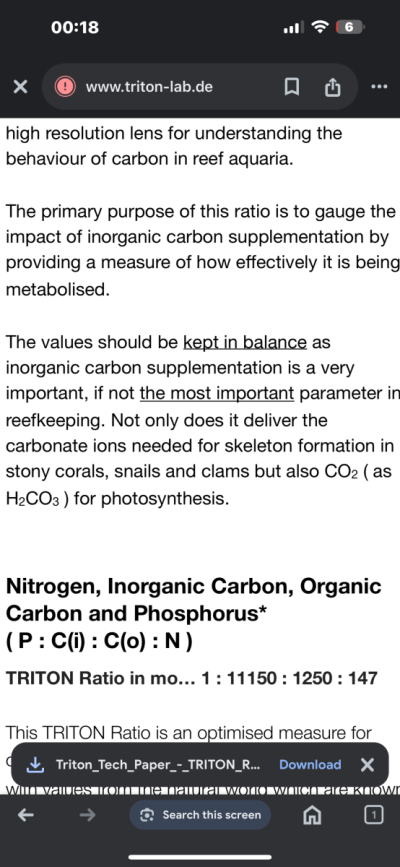
Beyond that, it’s up to Triton to convince us of any significance, and the posted text certainly did not do it for me.
Personally I’d accept all the numbers seem ok and be done with it.
Beyond that, it’s up to Triton to convince us of any significance, and the posted text certainly did not do it for me.
Well that got me confuzzled too, why no values but I’m in the redI have a real problem seeing the rationale here. All the measurements are in the green. Some ratios are fine and some Triton doesn’t like. I’m not even sure how three or four things can be a single ratio.
Personally I’d accept all the numbers seem ok and be done with it.
Beyond that, it’s up to Triton to convince us of any significance, and the posted text certainly did not do it for me.
I mean anything like a set point they put on all their analysis is useful but without 16-1-2 and set point being 10-5-3 what do I get from being red?
They’re not selling anything though which with the icp it’s always low on traces they want you to add and give it an importance star rating but this is putting people on edge
Randy Holmes-Farley
Reef Chemist
View Badges
Staff member
Super Moderator
Excellence Award
Expert Contributor
Article Contributor
R2R Research
My Tank Thread
Well that got me confuzzled too, why no values but I’m in the red
I mean anything like a set point they put on all their analysis is useful but without 16-1-2 and set point being 10-5-3 what do I get from being red?
They’re not selling anything though which with the icp it’s always low on traces they want you to add and give it an importance star rating but this is putting people on edge
They are selling the test. It’s up to them, IMO, to show its utility.
the whole “ratio” and series of comparisons appears to be just a fancy way to look at trying to make analytics look fancier or more meaningful than they are without providing any relationship between a ratio and predicted outcome or suggestions based on those numbers. I get it that as scientists we try to establish any relationship we can and sometimes this leads to a set of parameters that turns out to be very meaningful but this is unlikely to happen with this sort of data considering that any one user is looking at so many parameters that are not documented at all to ever make this a meaningful experimental dataset.
Of course, silly meThey are selling the test. It’s up to them, IMO, to show its utility.
Last question, what would the order of coral growth inhibitors in stonys
I.e
Unstable kh
Unstable po4
Low ph etc
I get ya drift man, cheersthe whole “ratio” and series of comparisons appears to be just a fancy way to look at trying to make analytics look fancier or more meaningful than they are without providing any relationship between a ratio and predicted outcome or suggestions based on those numbers. I get it that as scientists we try to establish any relationship we can and sometimes this leads to a set of parameters that turns out to be very meaningful but this is unlikely to happen with this sort of data considering that any one user is looking at so many parameters that are not documented at all to ever make this a meaningful experimental dataset.
Hello! You should check the results on a computer. The results you posted here for Triton Ratios are not the same as the ones in the link you sent, when I checked in my pc. All your ratios are green
Similar threads
- Replies
- 24
- Views
- 680
- Replies
- 5
- Views
- 147
- Replies
- 3
- Views
- 101
- Replies
- 1
- Views
- 51
- Replies
- 3
- Views
- 117


