"Biodiversity is dead, long live biodiversity" 10 month microbiome data from BRStv.

BRS

Dan_P

5000 Club Member
Review score
+0 /0 /-0
View Badges
Joined
Sep 21, 2018
Messages
5,279
Reaction score
5,675
Review score
+0 /0 /-0
Rating - 0%
0   0   0
Let's try to illustrate sixty's point here in a chart....


The below chart shows my subjective 1-10 "uglies score" at 15 weeks for each tanks, but split them into two groups.
The blue ones (first 7 listed) are ones that had photosynthetic material from lighted system that was placed directly into the test tanks.
The red bars (last 5) are the ones that either had no photosynthetic material, or who had a very extended dark cure time, or were never added to the lighted part of the tank (dark rubble).

View attachment 3109514

I share Ryan's conclusion here that I just wouldn't take lighted material from one system (or the ocean) and put it in a new system in a lighted portion. Not if I wanted to make life as easy as possible, anyway. In the absence of dedicated herbivores from the first week - it's sort of a foregone conclusion, like sixty said.

(I might point out here the similarities between the dark rubble treatment and the aquabiomics article here Establishing a Healthy Microbiome in a New Aquarium Using Live Rock. Interesting to see what results do get replicated.)
Just reread the Aquabiomics report and found similar experimental shortcomings that exist in the BRS experiment. The most serious is the lack of consistency of the organic and maybe even inorganic nitrogen concentration across the tanks. Like BRS, Aquabiomics rots live rock in the dark in the aquarium. While replications show similar effects in both replicates, the level of rotting biomass across experiments is not determined, nor is the algae accompanying each live rock sample taken into account. Another obvious missing or just unreported piece of information is concentration data for ammonia and nitrate throughout the experiment. It would have been very interesting to know what it was when livestock was added.

I am thinking right that nitrogen concentration played a role in the outcome of both Aquabiomics and BRS experiments, not biodiversity or balance. Also, I am thinking that we need to develop a new seeding method when using solid inoculum like live rock at least for conducting experiments if not for staring aquaria.
 
AquaCave Logo Banner
OP
OP
taricha

taricha

5000 Club Member
Review score
+0 /0 /-0
View Badges
Joined
May 22, 2016
Messages
5,485
Reaction score
8,153
Review score
+0 /0 /-0
Rating - 0%
0   0   0
I am thinking right that nitrogen concentration played a role in the outcome of both Aquabiomics and BRS experiments, not biodiversity or balance.
To be clear, you are suggesting that the differences in algal growth - in the BRS study and seen here in the aquabiomics article linked above ....
uglies-tanks-pic.jpeg


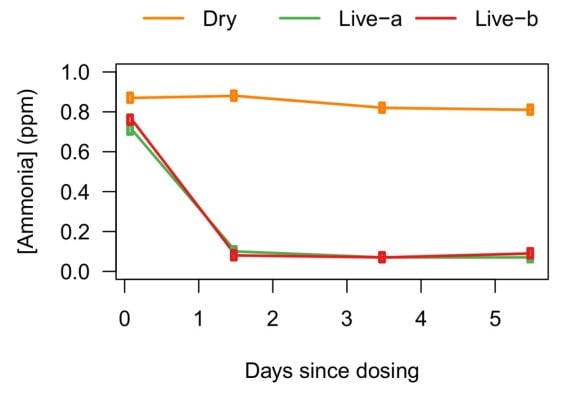
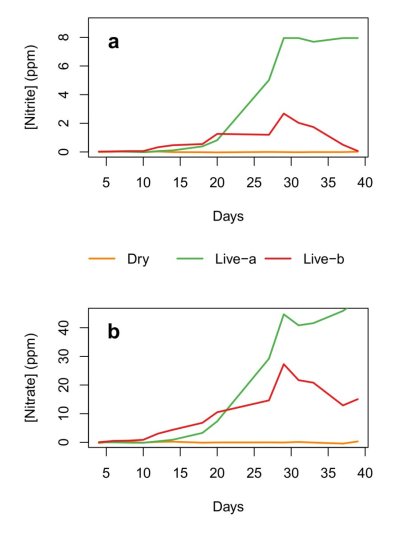
...are quite possibly due mostly to nutrient (N) differences. (I find this very plausible. You could even say the data supporting this is hinted at in the aquabiomics article itself. These charts demonstrate that inorganic N would have been far more prevalent for longer in the "Dry" and "Live Rock A" treatments. )

ammonia-depletion.jpegno2-and-no3.jpeg
(in fact the red vs green curves in this chart point strongly to what you suggest - vey high die-off in "Live-A" compared to "Live-B")


You aren't suggesting that the bacterial community differences are driven mostly by inorganic N in the water. (which I don't think fits with theory about these bacterial groups.)

I was reading this paper yesterday or today (posted by aquabiomics in another discussion) and thinking about how much more you'd like it than the other data we've been discussing. :)
Microbial Community Succession and Nutrient Cycling Responses following Perturbations of Experimental Saltwater Aquaria

They measured nutrients thoughout and even did stuff you like that I think is a bit daft like measuring the biome coming out of a bag of dry sand to ensure that the biome in the dry sand started aquarium looks like the bag. (result - they both look like human interaction/contamination)
 

Dan_P

5000 Club Member
Review score
+0 /0 /-0
View Badges
Joined
Sep 21, 2018
Messages
5,279
Reaction score
5,675
Review score
+0 /0 /-0
Rating - 0%
0   0   0
To be clear, you are suggesting that the differences in algal growth - in the BRS study and seen here in the aquabiomics article linked above ....
View attachment 3121943


...are quite possibly due mostly to nutrient (N) differences. (I find this very plausible.
Yes, nitrogen concentration has a strong effect on growth rates, maybe even the species that flourish.

You could even say the data supporting this is hinted at in the aquabiomics article itself. These charts demonstrate that inorganic N would have been far more prevalent for longer in the "Dry" and "Live Rock A" treatments. )

View attachment 3121959View attachment 3121962
(in fact the red vs green curves in this chart point strongly to what you suggest - vey high die-off in "Live-A" compared to "Live-B")


You aren't suggesting that the bacterial community differences are driven mostly by inorganic N in the water. (which I don't think fits with theory about these bacterial groups.)
Correct, determining which bacteria dominate the biofilm is complicated and difficult to predict. I do wonder though how the absolute population size determines the role the biome plays in the aquarium. A small balanced biome vs a huge balanced biome,

I was reading this paper yesterday or today (posted by aquabiomics in another discussion) and thinking about how much more you'd like it than the other data we've been discussing. :)
Microbial Community Succession and Nutrient Cycling Responses following Perturbations of Experimental Saltwater Aquaria

I will read this right after walking the dogs. Thanks
They measured nutrients thoughout and even did stuff you like that I think is a bit daft like measuring the biome coming out of a bag of dry sand to ensure that the biome in the dry sand started aquarium looks like the bag. (result - they both look like human interaction/contamination)
 
www.dinkinsaquaticgardens.com

Dan_P

5000 Club Member
Review score
+0 /0 /-0
View Badges
Joined
Sep 21, 2018
Messages
5,279
Reaction score
5,675
Review score
+0 /0 /-0
Rating - 0%
0   0   0
I was reading this paper yesterday or today (posted by aquabiomics in another discussion) and thinking about how much more you'd like it than the other data we've been discussing. :)
Microbial Community Succession and Nutrient Cycling Responses following Perturbations of Experimental Saltwater Aquaria

They measured nutrients thoughout and even did stuff you like that I think is a bit daft like measuring the biome coming out of a bag of dry sand to ensure that the biome in the dry sand started aquarium looks like the bag. (result - they both look like human interaction/contamination)

Thanks again for the paper.

It seems they made the rookie mistake of measuring nitrate in the presence of nitrite. I will have to see if that changes any conclusions. Probably not.

Nice paper and it will need further study to appreciate the detail. Too bad they only focused on nitrogen cycling and did not consider organic carbon cycling versus OTU’s. I guess linking nitrogen cycling to eDNA was easier, and cheaper for the already already well established process. I never seem to hear anything about what these other bacteria do to benefit the aquarium.
 

Dan_P

5000 Club Member
Review score
+0 /0 /-0
View Badges
Joined
Sep 21, 2018
Messages
5,279
Reaction score
5,675
Review score
+0 /0 /-0
Rating - 0%
0   0   0
I was reading this paper yesterday or today (posted by aquabiomics in another discussion) and thinking about how much more you'd like it than the other data we've been discussing. :)
Microbial Community Succession and Nutrient Cycling Responses following Perturbations of Experimental Saltwater Aquaria

They measured nutrients thoughout and even did stuff you like that I think is a bit daft like measuring the biome coming out of a bag of dry sand to ensure that the biome in the dry sand started aquarium looks like the bag. (result - they both look like human interaction/contamination)
I noticed the aquaria had a sand depth of 30 cm. I guess the students will be investigate pore water chemistry.

The “daft“ stuff in the paper probably added to the uniqueness of the study, and therefore, more publishable. You will recall, I thought the lack of an initial biome assessment in the BRS experiment was a mistake :)
 

fredward

Community Member
Review score
+0 /0 /-0
View Badges
Joined
Jan 17, 2023
Messages
35
Reaction score
67
Review score
+0 /0 /-0
Location
San Diego
Rating - 0%
0   0   0
Just read the whole thread. Good discussion everyone! Very interesting. As a rookie I was enthralled by the brs experiment, but it’s great to have its shortcomings pointed out and to see how much we can extrapolate from the data. Really wish all this experimentation was done years ago so I could benefit from it now lol
 
Corals.com
BRS

Polyp polynomial: How many heads do you start with when buying zoas?

  • One head is enough to get started.

    Votes: 27 10.6%
  • 2 to 4 heads.

    Votes: 145 57.1%
  • 5 heads or more.

    Votes: 65 25.6%
  • Full colony.

    Votes: 10 3.9%
  • Other.

    Votes: 7 2.8%

New Posts

SR
Back
Top